


-
- Trading Platforms
- PU Prime App
- MetaTrader 5
- MetaTrader 4
- PU Copy Trading
- Web Trader
- PU Social
-
- Trading Conditions
- Account Types
- Spreads, Costs & Swaps
- Deposits & Withdrawals
- Fee & Charges
- Trading Hours

EN
4 July 2024,05:25
Daily Market Analysis
4 July 2024, 05:25

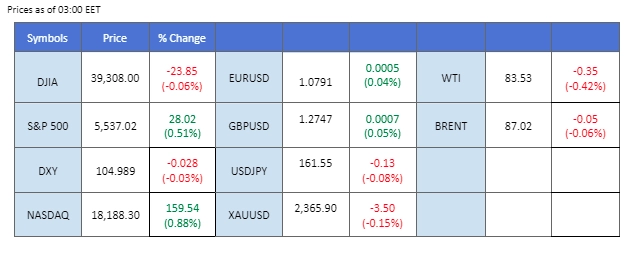
In the last session, Wall Street saw a notable rally with the Nasdaq and S&P 500 reaching all-time highs, while the Dow Jones lagged. This surge was driven by soft job data, suggesting that the Federal Reserve may proceed with its plan to begin cutting rates in the third quarter of the year. Market predictions now include two rate cuts in 2024, with increasing bets on a September cut. Traders are closely watching Friday’s NFP report for clearer indications of the Fed’s upcoming monetary policy moves.
The dollar eased on the soft U.S. job data, while the euro and the Pound Sterling were buoyed by upbeat PMI readings released yesterday. These factors contributed to a stronger performance for both currencies against the dollar.
In the commodity market, gold prices climbed to their highest level in a week, supported by the soft U.S. economic indicators and trader positioning for an early Fed rate cut. Oil prices, on the other hand, remained elevated, bolstered by positive weekly crude data suggesting increasing demand in the U.S.
In the cryptocurrency market, both BTC and ETH continued to slide. The BTC ETF observed net outflows, while a spike in BTC transfer volume led to market speculation that the defunct crypto exchange Mt. Gox might have started releasing $9 billion worth of BTC for repayment.
Current rate hike bets on 31st July Fed interest rate decision:
Source: CME Fedwatch Tool
0 bps (89.7%) VS -25 bps (10.3%)
(MT4 System Time)
N/A
Source: MQL5
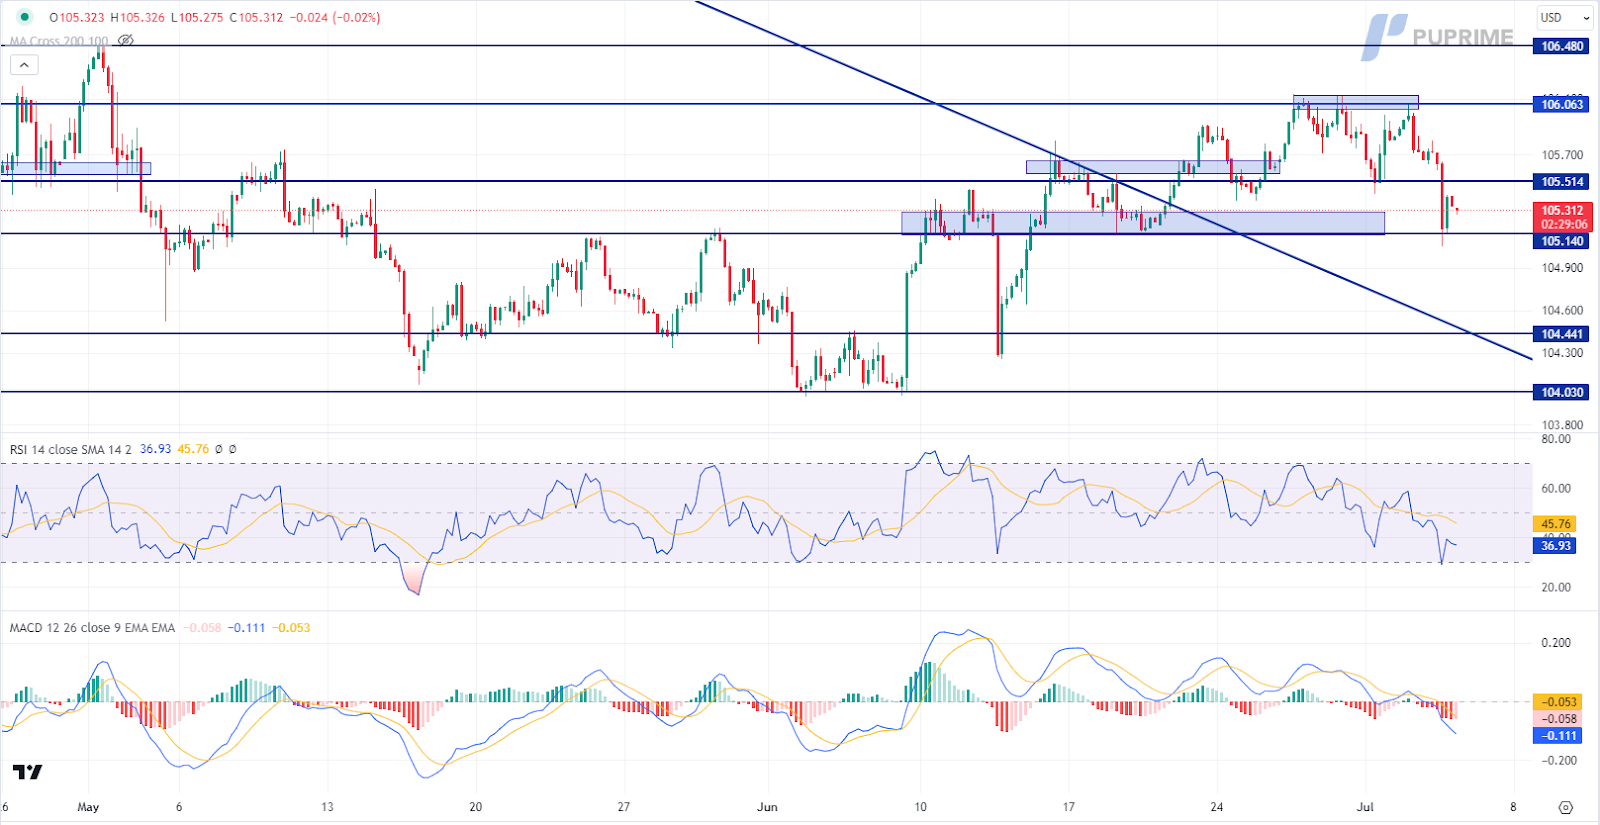
The Dollar Index, which tracks the US dollar against a basket of six major currencies, dipped sharply due to weaker-than-expected US economic reports, reinforcing expectations for the Federal Reserve to ease monetary policy this year. Fed Chair Jerome Powell’s dovish statements, combined with downbeat data, including disappointing ADP Nonfarm Employment Change (150K vs. 234K expected) and US Initial Jobless Claims (238K vs. 163K expected), weighed heavily on the dollar. Additionally, the ISM Non-Manufacturing PMI fell to 48.8, missing expectations of 52.6. Investors should watch the upcoming Nonfarm Payrolls and Unemployment rate reports for further clarity.
The Dollar Index is trading lower following the prior breakout below the previous support level. However, MACD has illustrated diminishing bearish momentum, while RSI is at 37, suggesting the index might experience technical correction since the RSI rebounded sharply from oversold territory.
Resistance level: 105.50, 106.05
Support level: 105.15, 104.45
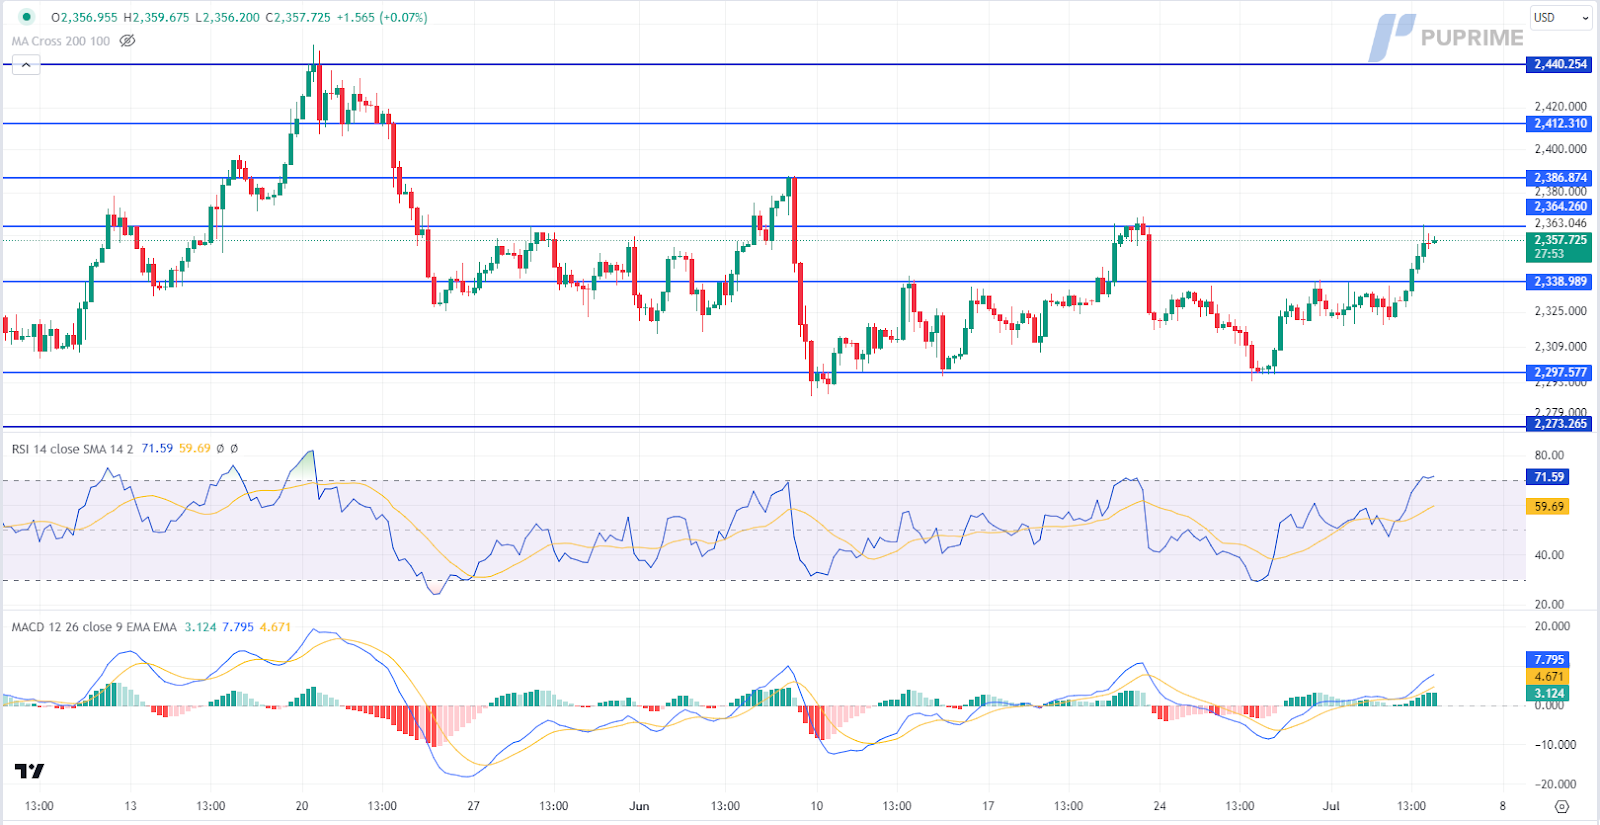
Gold prices rebounded sharply, buoyed by the depreciation of the US dollar and the potential risk-off sentiment sparked by the US Presidential election and the French election. The biggest boost for the gold market came from the release of downbeat US economic data. With rising expectations for rate cuts, several market participants decided to invest in safe-haven gold.
Gold prices are trading higher while currently testing the resistance level. MACD has illustrated increasing bullish momentum. However, RSI is at 72, suggesting the commodity might enter overbought territory.
Resistance level: 2365.00, 2385.00
Support level: 2340.00, 2295.00
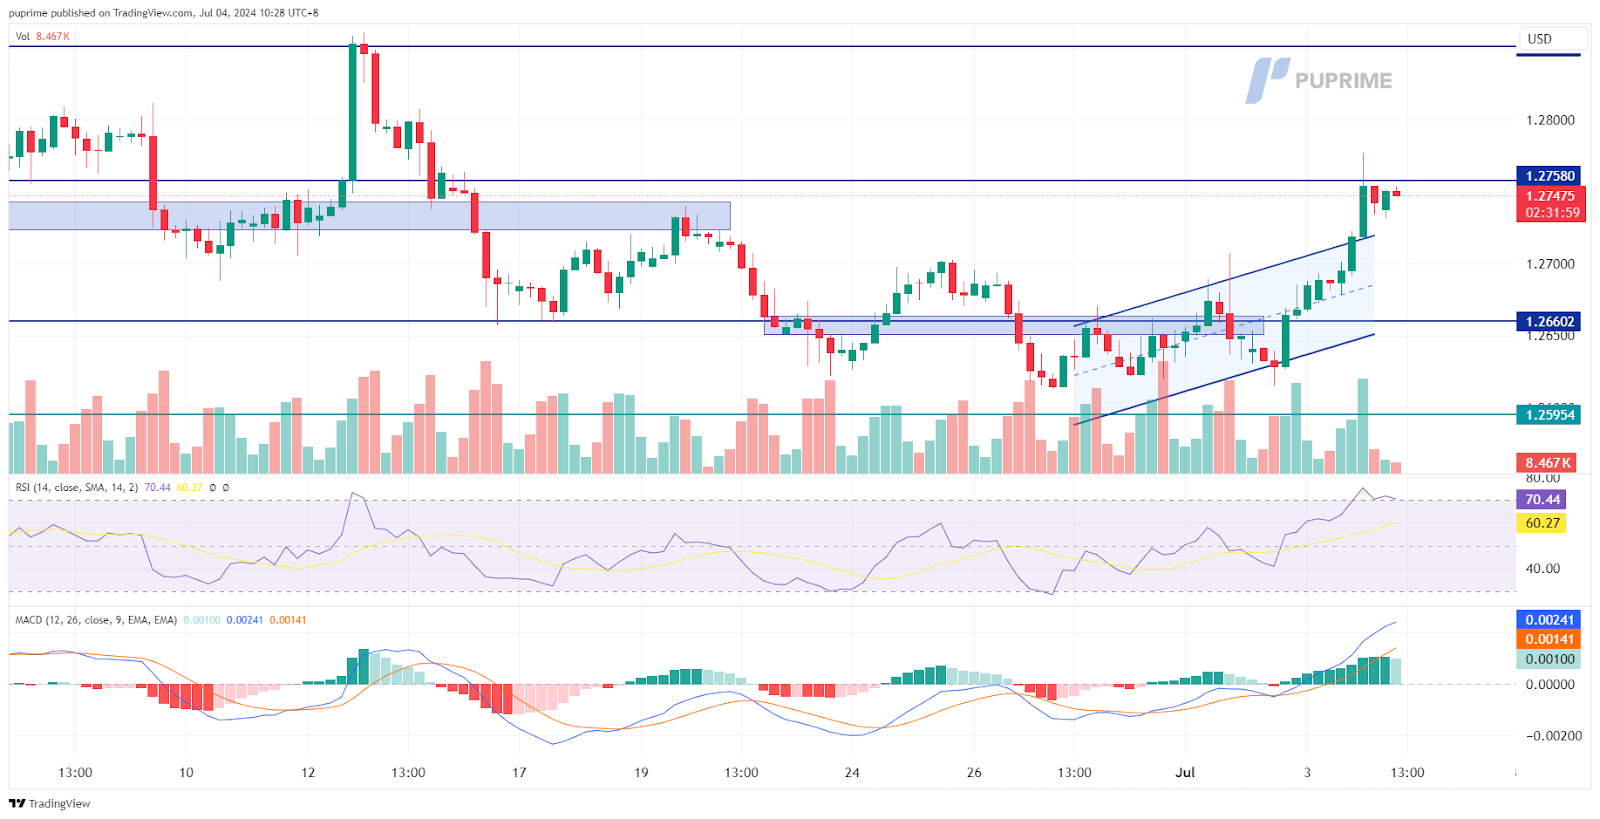
The GBP/USD pair confirmed its trend reversal pattern, rising nearly 0.5% in the last session. This upward movement was driven by the UK’s PMI reading, which exceeded market expectations and strengthened the Sterling. Additionally, soft U.S. job data weakened the dollar, allowing the pair to trade higher. Traders should monitor Friday’s NFP reading closely, as it could serve as a catalyst for the pair to challenge new highs. The outcome of this data will be crucial in shaping market sentiment and potential future movements of the GBP/USD pair.
GBP/USD has broken above its uptrend channel, suggesting a bullish bias for the pair. The RSI has broken into the overbought zone, while the MACD has edged higher above the zero line and is diverging, suggesting that the bullish momentum is gaining.
Resistance level: 1.2760, 1.2850
Support level: 1.2600, 1.2540
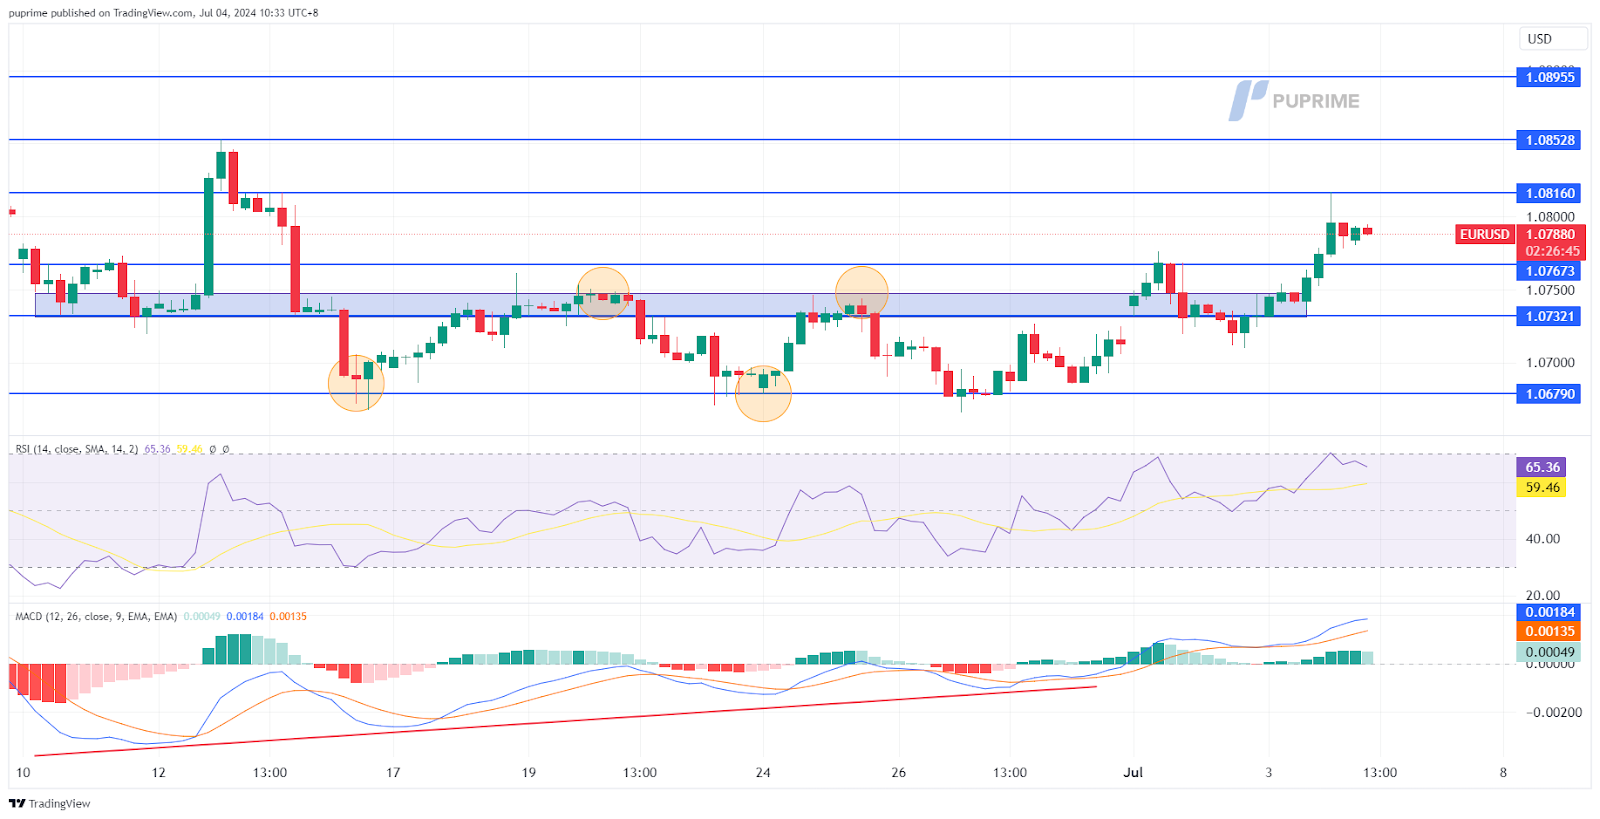
The EUR/USD pair found support at its critical liquidity zone, rebounding sharply in the last session. The euro’s strength was fueled by the eurozone PMI reading, which came in above 50, indicating that economic growth in the region is surpassing market expectations. Simultaneously, disappointing U.S. Initial Jobless Claims and ADP Nonfarm Employment Change data suggest a softening U.S. economy, which has weakened the dollar’s strength.
EUR/USD has risen to its highest level in three weeks, followed by a consolidation price pattern suggesting a bullish bias for the pair. The RSI is on the brink of breaking into the overbought zone, while the edged higher and is diverging, suggesting fresh bullish momentum is forming.
Resistance level: 1.0810, 1.0870
Support level: 1.0767, 1.0735
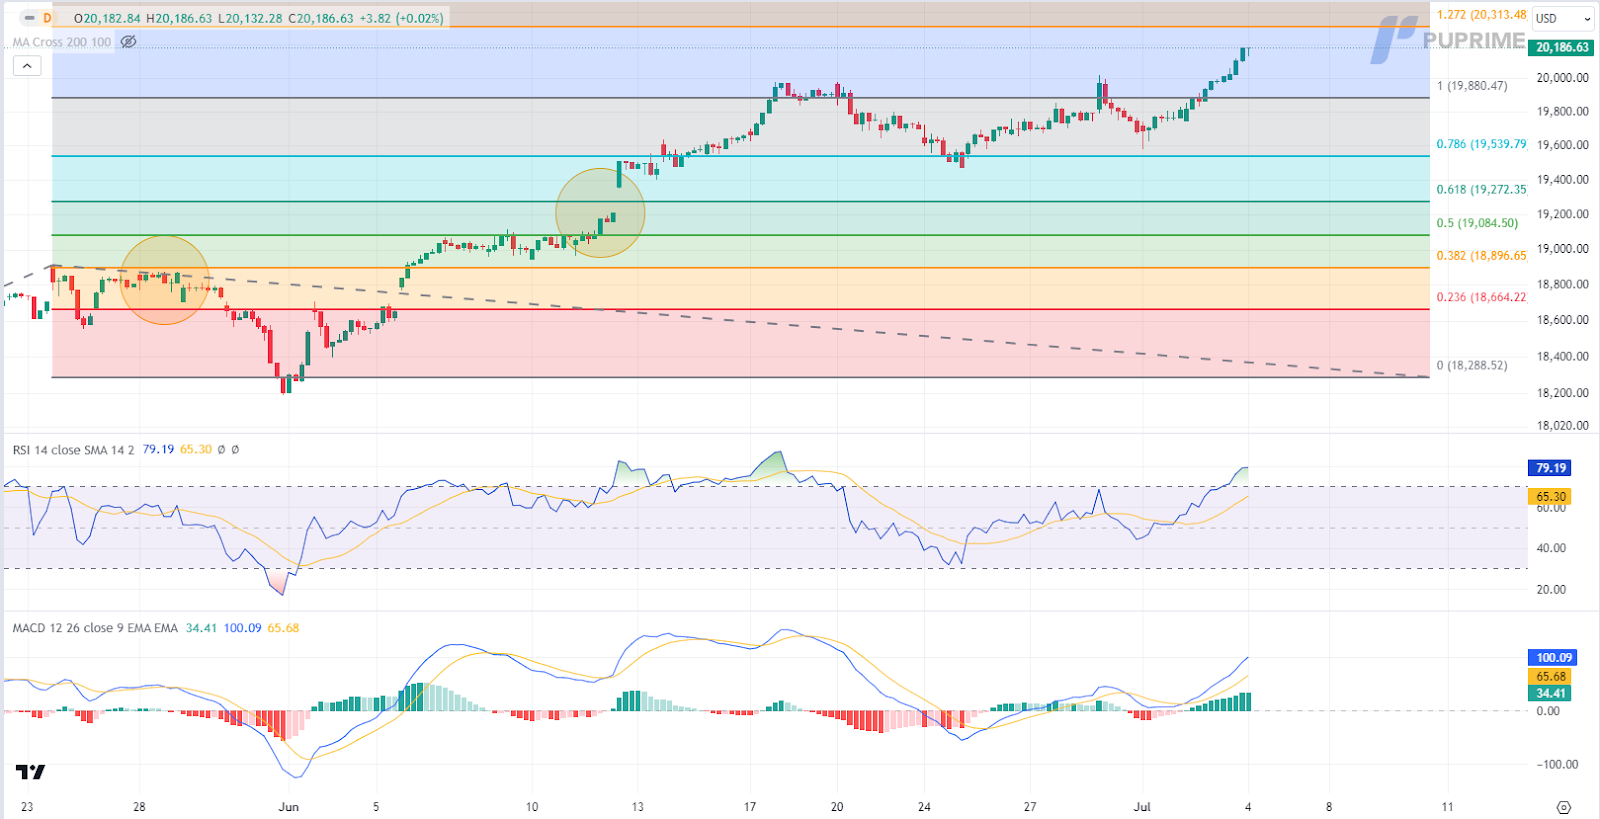
The US equity market rebounded sharply as downbeat economic data prompted a decline in US Treasury yields. Pessimistic economic outlooks raised market expectations of further rate cuts from the Fed, supporting the equity market. Economists expect a 190,000 gain in June Nonfarm Payrolls, with the unemployment rate holding at 4%. Investors should keep an eye on these reports for additional trading signals.
Nasdaq is trading higher following the prior breakout above the previous resistance level. MACD has illustrated increasing bullish momentum. However, RSI is at 79, suggesting the index might enter overbought territory.
Resistance level: 20315.00, 20865.00
Support level: 19880.00, 19540.00
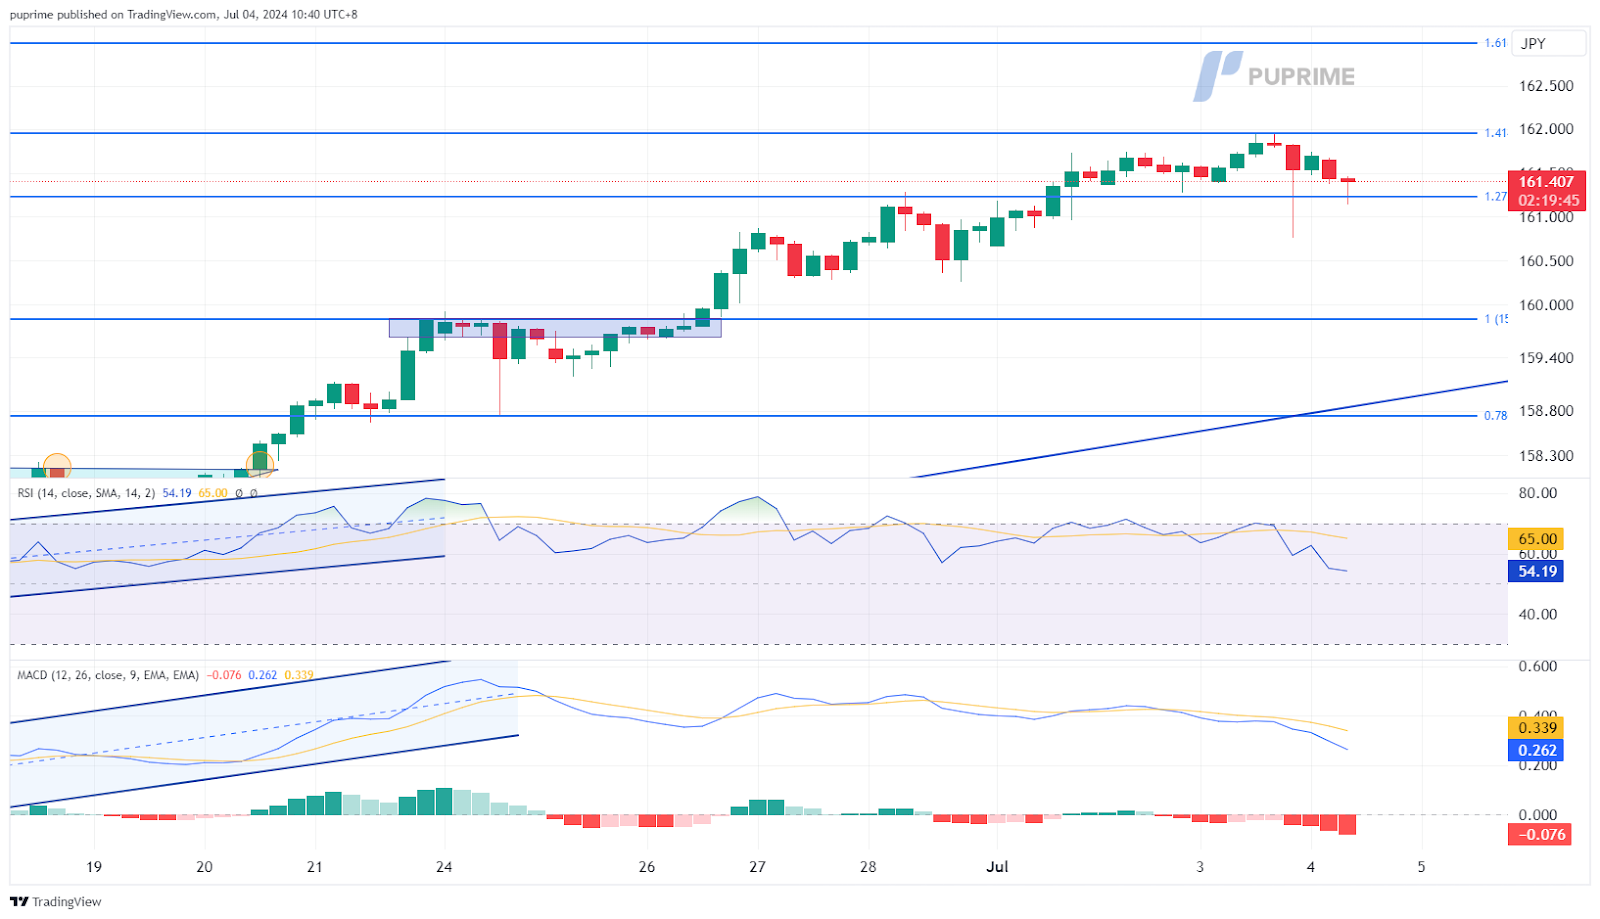
The USD/JPY pair took a breather in the last session, easing from its recent highs after being rejected at the 162 mark. The U.S. dollar’s strength has softened, providing some relief to the pair. Recent lacklustre Japanese economic data have cast doubt on the Bank of Japan’s (BoJ) ability to raise interest rates at its month-end meeting. The market remains unconvinced about the Japanese central bank’s capacity to implement a rate hike. With the U.S. public holiday on Thursday, traders are speculating that Japanese authorities might take this opportunity to intervene in the currency market to support the yen.
The pair was rejected to climb above its next milestone at the 162.00 mark, suggesting a potential technical retracement for the pair. The RSI has eased near the overbought zone while the MACD edge is lower from the elevated level, suggesting the bullish momentum is easing.
Resistance level: 162.00, 162.95
Support level: 161.20, 160.35
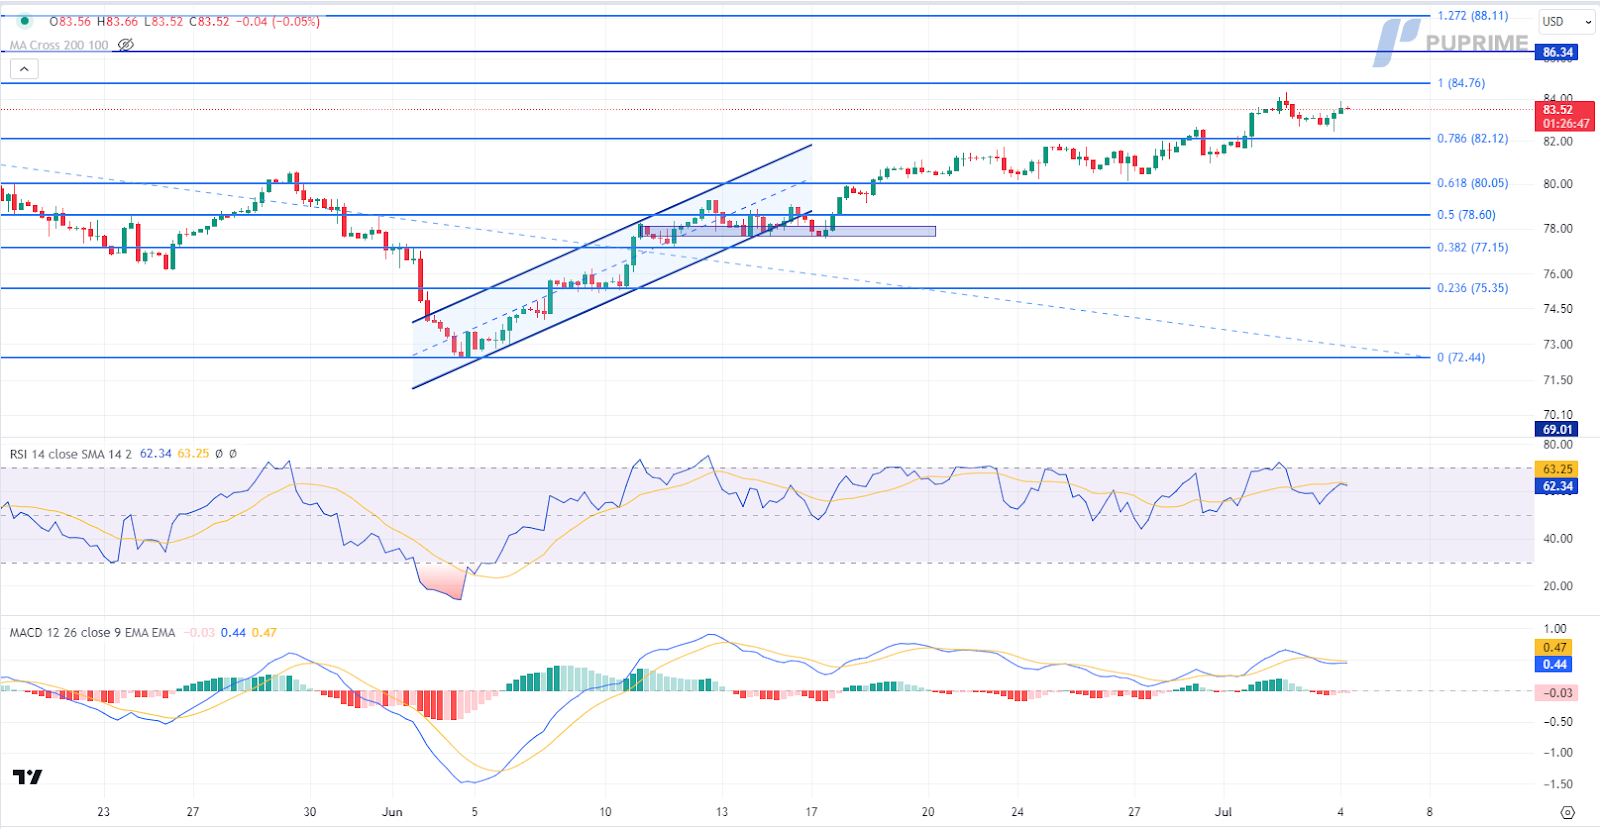
Crude oil prices extended their gains, buoyed by a better-than-expected oil inventory report. According to the Energy Information Administration (EIA), US crude oil inventories declined sharply by 12.157 million barrels, a much larger drop than the market expectations of a 400K decline. This inventory report continues to support oil prices. Additionally, the depreciation of the US dollar has also supported dollar-denominated oil prices.
Oil prices are trading higher following the prior rebound from the support level. MACD has illustrated diminishing bearish momentum, while RSI is at 62, suggesting the commodity might extend its gains since the RSI stays above the midline.
Resistance level: 84.75, 86.35
Support level: 82.10, 80.05
Step into the world of trading with confidence today. Open a free PU Prime live CFD trading account now to experience real-time market action, or refine your strategies risk-free with our demo account.
Disclaimer
This content is for educational and informational purposes only and should not be considered investment advice, a personal recommendation, or an offer to buy or sell any financial instruments.
This material has been prepared without considering any individual investment objectives, financial situations. Any references to past performance of a financial instrument, index, or investment product are not indicative of future results.
PU Prime makes no representation as to the accuracy or completeness of this content and accepts no liability for any loss or damage arising from reliance on the information provided. Trading involves risk, and you should carefully consider your investment objectives and risk tolerance before making any trading decisions. Never invest more than you can afford to lose.

Trade forex, indices, metal, and more at industry-low spreads and lightning-fast execution.
Sign up for a PU Prime Live Account with our hassle-free process.
Effortlessly fund your account with a wide range of channels and accepted currencies.
Access hundreds of instruments under market-leading trading conditions.
Trading Platforms
Learn
About PU Prime
Corporate

Please note the Website is intended for individuals residing in jurisdictions where accessing the Website is permitted by law.
Please note that PU Prime and its affiliated entities are neither established nor operating in your home jurisdiction.
By clicking the "Acknowledge" button, you confirm that you are entering this website solely based on your initiative and not as a result of any specific marketing outreach. You wish to obtain information from this website which is provided on reverse solicitation in accordance with the laws of your home jurisdiction.
Thank You for Your Acknowledgement!
Ten en cuenta que el sitio web está destinado a personas que residen en jurisdicciones donde el acceso al sitio web está permitido por la ley.
Ten en cuenta que PU Prime y sus entidades afiliadas no están establecidas ni operan en tu jurisdicción de origen.
Al hacer clic en el botón "Aceptar", confirmas que estás ingresando a este sitio web por tu propia iniciativa y no como resultado de ningún esfuerzo de marketing específico. Deseas obtener información de este sitio web que se proporciona mediante solicitud inversa de acuerdo con las leyes de tu jurisdicción de origen.
Thank You for Your Acknowledgement!