


-
- Trading Platforms
- PU Prime App
- MetaTrader 5
- MetaTrader 4
- PU Copy Trading
- Web Trader
- PU Social
-
- Trading Conditions
- Account Types
- Spreads, Costs & Swaps
- Deposits & Withdrawals
- Fee & Charges
- Trading Hours


EN
25 March 2025,05:54
Daily Market Analysis
25 March 2025, 05:54


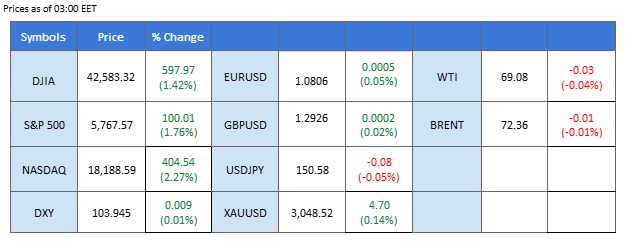
Market Summary
The U.S. PMI data came in stronger than expected in the last session, reinforcing the resilience of the U.S. economy. Notably, Atlanta Fed President Raphael Bostic signaled a more cautious stance on rate cuts, stating that he now foresees only one rate cut this year, citing the need to account for potential inflationary pressures from Trump’s tariff hikes.
Following these developments, the dollar index surged to a two-week high after breaking out of its consolidation range, signaling a potential bullish trend reversal for the greenback. Meanwhile, Wall Street showed signs of stabilizing, with all three major indices closing higher, suggesting that the recent selloff may be losing steam.
In the commodities market, oil prices continued their upward momentum, with WTI approaching the $70 mark. Market sentiment was further fueled by reports that President Trump plans to impose tariffs on countries purchasing oil from Venezuela, raising concerns over tighter global supply. Conversely, gold prices have remained under pressure as the stronger dollar weighed on the precious metal. If gold fails to hold above the $3,005 support level, further downside could be expected.
Additionally, the Bank of Japan’s (BoJ) meeting minutes were released earlier, revealing that board members suggested keeping real interest rates in negative territory. This dovish stance weighed on the Japanese yen, causing it to extend its decline against its peers. The yen’s weakness further reinforced the bullish momentum in USD/JPY, which is now maintained at above the key 150.00 level. A breakout above this resistance could signal further upside for the pair.
Current rate hike bets on 7th May Fed interest rate decision:
Source: CME Fedwatch Tool
0 bps (90%) VS -25 bps (10%)
Market Overview
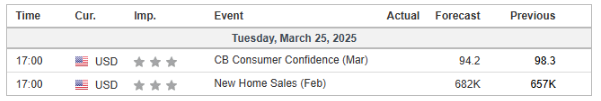
Economic Calendar
(MT4 System Time)
Source: MQL5
Market Movements

The Dollar Index rebounded slightly after US President Donald Trump hinted at a softer stance on tariffs, easing investor concerns. He also suggested possible exemptions for certain countries, which could help reduce global trade tensions and support the US economic outlook. Meanwhile, the US continued to release strong economic data. The US S&P Global Services PMI increased from 51.0 to 54.3, surpassing market expectations of 51.2. However, the dollar’s gains were limited by weaker-than-expected manufacturing PMI data, which came in at 49.8, falling short of the expected 51.9.
The Dollar Index is trading higher while currently testing the resistance level. However, MACD has illustrated increasing bearish momentum, while RSI is at 53, suggesting the index might experience technical correction since the RSI retraced from overbought territory.
Resistance level: 104.40, 104.85
Support level: 103.85, 103.30

Gold prices retreated as risk-on sentiment gained traction, reducing demand for safe-haven assets. Additionally, ongoing Russia-Ukraine ceasefire discussions further dampened gold’s appeal. However, uncertainty remains as the US tariff strategy continues to shift, contributing to market volatility. Investors will closely watch trade developments and ceasefire negotiations to gauge potential market movements.
Gold prices are trading flat while currently testing the resistance level. MACD has illustrated increasing bullish momentum, while RSI is at 50, suggesting the commodity might extend its gains after breakout since the RSI rebounded sharply from oversold territory.
Resistance level: 3025.00, 3070.00
Support level: 3015.00, 3005.00

The GBP/USD pair remains subdued, hovering near its recent lows, signaling a bearish bias. The UK PMI readings were mixed, with the Manufacturing PMI falling below the 50 level, indicating contraction in the sector and weighing on the Pound Sterling. Meanwhile, the U.S. dollar has been gaining strength in recent sessions, further pressuring the pair. If the bearish momentum persists, GBP/USD may test lower support levels in the near term.
The GBP/USD continued to slide after the pair dropped below the uptrend support level, suggesting a bearish bias for the pair. The RSI slid to below the 50 level, while the MACD has broken below the zero line, suggesting that bearish momentum may be forming.
Resistance level: 1.3000, 1.3105
Support level: 1.2875, 1.2785

The EUR/USD pair has slipped below its key support level at 1.0810, reinforcing a bearish bias. The euro failed to find support from the latest eurozone and German PMI readings, as the data fell short of catalyzing any upside momentum. Meanwhile, the strengthening U.S. dollar continues to exert pressure on the pair, driving it to a two-week low. If the bearish momentum persists, EUR/USD may extend its decline toward the next support level.
The EUR/USD pair has dipped below its support level and reached a new low, suggesting a bearish bias for the pair. It is approaching the oversold zone, while the MACD has broken below from the zero line and is edging lower, suggesting that the bearish momentum is gaining.
Resistance level: 1.0955, 1.1075
Support level: 1.0672, 1.0527

The USD/JPY pair surged to a new three-week high, marking its strongest level in March and reinforcing a bullish bias. The U.S. dollar’s recent strength has supported the rally, while the Japanese yen remains under pressure following the dovish BoJ meeting minutes. The central bank’s board signaled a preference for keeping real interest rates in negative territory, suggesting a continued accommodative stance to support economic growth. If the pair breaks above the key resistance level at 153.30, it could signal further bullish momentum.
USD/JPY has reached a new high and has been trading in a higher-high price pattern, suggesting a bullish bias for the pair. The RSI is poised to break into the overbought zone, while the MACD is diving above the zero line, suggesting that the bullish momentum is gaining.
Resistance level: 151.35, 152.75
Support level: 150.15, 149.25

Nasdaq surged 2.3%, reversing losses as Trump signaled tariff exemptions, easing pressure on semiconductors and autos. Tesla jumped 12% on delayed auto tariff hopes, while Ant Group’s AI chip cuts pressured Nvidia but lifted tech. Still, policy risks loom. Tariff uncertainty and AI-driven earnings revisions could stall gains, with PCE inflation data on March 29 set to shape Fed expectations. Nasdaq eyes 18,000, but 16,800 remains key support amid trade risks.
NASDAQ is now testing resistance at 20,745; a breakout above this level could signal further bullish momentum toward 21,890. Both the RSI and MACD have been trending upward, indicating strengthening bullish momentum, which aligns with the current uptrend. However, with RSI approaching overbought territory, a potential pullback or consolidation should not be ruled out.
Resistance level: 20308.00, 20704.00
Support level: 19935.00, 19395.00

Despite BTC maintaining a higher-high price pattern recently, it failed to break above the critical $90,000 resistance level and slid below $87,000, prompting traders to remain cautious about a potential bearish trend reversal. However, BTC ETFs continue to record net inflows, and the Crypto Fear and Greed Index shows improvement—both factors that could help provide support and limit downside risks for BTC prices.
BTC has been trading in a higher-high manner but failed to notch the $89,000 mark and encountered a retracement. Should BTC dip below the previous high at near the $86,000 mark, it may suggest a bearish signal for BTC. Both the RSI and MACD remain elevated, suggesting that BTC remains in trading with bullish momentum.
Resistance level: 92,825.00, 99,340.00
Support level: 84,875.00, 78,530.00

WTI crude rallied 1%-1.2% to $69.11/bbl, driven by the U.S. 25% tariff on Venezuelan oil buyers, while Brent hit $73/bbl. Market volatility remains high, balancing supply risks from tariffs against supply relief from Chevron’s extended Venezuela license (May 27). OPEC+ may proceed with a May output hike, while unconfirmed reports suggest potential U.S. restrictions on Iranian oil. Near-term, WTI could test $75-$80 if China and India reduce Venezuelan imports, but OPEC+ supply hikes and U.S. shale recovery pose downside risks.
Oil prices are now testing resistance at 69.24; a breakout above this level could signal further bullish momentum toward 70.49 and 71.78. However, both the RSI and MACD are showing bearish divergence, suggesting that upward momentum is weakening and a potential pullback or consolidation may occur. If prices fail to break higher, a correction toward 68.38 or 67.66 could be expected.
Resistance level: 69.24, 70.49
Support level: 68.38, 67.66
Step into the world of trading with confidence today. Open a free PU Prime live CFD trading account now to experience real-time market action, or refine your strategies risk-free with our demo account.
This content is for educational and informational purposes only and should not be considered investment advice, a personal recommendation, or an offer to buy or sell any financial instruments.
This material has been prepared without considering any individual investment objectives, financial situations. Any references to past performance of a financial instrument, index, or investment product are not indicative of future results.
PU Prime makes no representation as to the accuracy or completeness of this content and accepts no liability for any loss or damage arising from reliance on the information provided. Trading involves risk, and you should carefully consider your investment objectives and risk tolerance before making any trading decisions. Never invest more than you can afford to lose.

Trade forex, indices, metal, and more at industry-low spreads and lightning-fast execution.
Sign up for a PU Prime Live Account with our hassle-free process.
Effortlessly fund your account with a wide range of channels and accepted currencies.
Access hundreds of instruments under market-leading trading conditions.
Trading Platforms
Learn
About PU Prime
Corporate

Please note the Website is intended for individuals residing in jurisdictions where accessing the Website is permitted by law.
Please note that PU Prime and its affiliated entities are neither established nor operating in your home jurisdiction.
By clicking the "Acknowledge" button, you confirm that you are entering this website solely based on your initiative and not as a result of any specific marketing outreach. You wish to obtain information from this website which is provided on reverse solicitation in accordance with the laws of your home jurisdiction.
Thank You for Your Acknowledgement!
Ten en cuenta que el sitio web está destinado a personas que residen en jurisdicciones donde el acceso al sitio web está permitido por la ley.
Ten en cuenta que PU Prime y sus entidades afiliadas no están establecidas ni operan en tu jurisdicción de origen.
Al hacer clic en el botón "Aceptar", confirmas que estás ingresando a este sitio web por tu propia iniciativa y no como resultado de ningún esfuerzo de marketing específico. Deseas obtener información de este sitio web que se proporciona mediante solicitud inversa de acuerdo con las leyes de tu jurisdicción de origen.
Thank You for Your Acknowledgement!
25 March 2025,05:54
Daily Market Analysis
25 March 2025, 05:54
Market Summary
The U.S. PMI data came in stronger than expected in the last session, reinforcing the resilience of the U.S. economy. Notably, Atlanta Fed President Raphael Bostic signaled a more cautious stance on rate cuts, stating that he now foresees only one rate cut this year, citing the need to account for potential inflationary pressures from Trump’s tariff hikes.
Following these developments, the dollar index surged to a two-week high after breaking out of its consolidation range, signaling a potential bullish trend reversal for the greenback. Meanwhile, Wall Street showed signs of stabilizing, with all three major indices closing higher, suggesting that the recent selloff may be losing steam.
In the commodities market, oil prices continued their upward momentum, with WTI approaching the $70 mark. Market sentiment was further fueled by reports that President Trump plans to impose tariffs on countries purchasing oil from Venezuela, raising concerns over tighter global supply. Conversely, gold prices have remained under pressure as the stronger dollar weighed on the precious metal. If gold fails to hold above the $3,005 support level, further downside could be expected.
Additionally, the Bank of Japan’s (BoJ) meeting minutes were released earlier, revealing that board members suggested keeping real interest rates in negative territory. This dovish stance weighed on the Japanese yen, causing it to extend its decline against its peers. The yen’s weakness further reinforced the bullish momentum in USD/JPY, which is now maintained at above the key 150.00 level. A breakout above this resistance could signal further upside for the pair.
Current rate hike bets on 7th May Fed interest rate decision:
Source: CME Fedwatch Tool
0 bps (90%) VS -25 bps (10%)
Market Overview
Economic Calendar
(MT4 System Time)
Source: MQL5
Market Movements
The Dollar Index rebounded slightly after US President Donald Trump hinted at a softer stance on tariffs, easing investor concerns. He also suggested possible exemptions for certain countries, which could help reduce global trade tensions and support the US economic outlook. Meanwhile, the US continued to release strong economic data. The US S&P Global Services PMI increased from 51.0 to 54.3, surpassing market expectations of 51.2. However, the dollar’s gains were limited by weaker-than-expected manufacturing PMI data, which came in at 49.8, falling short of the expected 51.9.
The Dollar Index is trading higher while currently testing the resistance level. However, MACD has illustrated increasing bearish momentum, while RSI is at 53, suggesting the index might experience technical correction since the RSI retraced from overbought territory.
Resistance level: 104.40, 104.85
Support level: 103.85, 103.30
Gold prices retreated as risk-on sentiment gained traction, reducing demand for safe-haven assets. Additionally, ongoing Russia-Ukraine ceasefire discussions further dampened gold’s appeal. However, uncertainty remains as the US tariff strategy continues to shift, contributing to market volatility. Investors will closely watch trade developments and ceasefire negotiations to gauge potential market movements.
Gold prices are trading flat while currently testing the resistance level. MACD has illustrated increasing bullish momentum, while RSI is at 50, suggesting the commodity might extend its gains after breakout since the RSI rebounded sharply from oversold territory.
Resistance level: 3025.00, 3070.00
Support level: 3015.00, 3005.00
The GBP/USD pair remains subdued, hovering near its recent lows, signaling a bearish bias. The UK PMI readings were mixed, with the Manufacturing PMI falling below the 50 level, indicating contraction in the sector and weighing on the Pound Sterling. Meanwhile, the U.S. dollar has been gaining strength in recent sessions, further pressuring the pair. If the bearish momentum persists, GBP/USD may test lower support levels in the near term.
The GBP/USD continued to slide after the pair dropped below the uptrend support level, suggesting a bearish bias for the pair. The RSI slid to below the 50 level, while the MACD has broken below the zero line, suggesting that bearish momentum may be forming.
Resistance level: 1.3000, 1.3105
Support level: 1.2875, 1.2785
The EUR/USD pair has slipped below its key support level at 1.0810, reinforcing a bearish bias. The euro failed to find support from the latest eurozone and German PMI readings, as the data fell short of catalyzing any upside momentum. Meanwhile, the strengthening U.S. dollar continues to exert pressure on the pair, driving it to a two-week low. If the bearish momentum persists, EUR/USD may extend its decline toward the next support level.
The EUR/USD pair has dipped below its support level and reached a new low, suggesting a bearish bias for the pair. It is approaching the oversold zone, while the MACD has broken below from the zero line and is edging lower, suggesting that the bearish momentum is gaining.
Resistance level: 1.0955, 1.1075
Support level: 1.0672, 1.0527
The USD/JPY pair surged to a new three-week high, marking its strongest level in March and reinforcing a bullish bias. The U.S. dollar’s recent strength has supported the rally, while the Japanese yen remains under pressure following the dovish BoJ meeting minutes. The central bank’s board signaled a preference for keeping real interest rates in negative territory, suggesting a continued accommodative stance to support economic growth. If the pair breaks above the key resistance level at 153.30, it could signal further bullish momentum.
USD/JPY has reached a new high and has been trading in a higher-high price pattern, suggesting a bullish bias for the pair. The RSI is poised to break into the overbought zone, while the MACD is diving above the zero line, suggesting that the bullish momentum is gaining.
Resistance level: 151.35, 152.75
Support level: 150.15, 149.25
Nasdaq surged 2.3%, reversing losses as Trump signaled tariff exemptions, easing pressure on semiconductors and autos. Tesla jumped 12% on delayed auto tariff hopes, while Ant Group’s AI chip cuts pressured Nvidia but lifted tech. Still, policy risks loom. Tariff uncertainty and AI-driven earnings revisions could stall gains, with PCE inflation data on March 29 set to shape Fed expectations. Nasdaq eyes 18,000, but 16,800 remains key support amid trade risks.
NASDAQ is now testing resistance at 20,745; a breakout above this level could signal further bullish momentum toward 21,890. Both the RSI and MACD have been trending upward, indicating strengthening bullish momentum, which aligns with the current uptrend. However, with RSI approaching overbought territory, a potential pullback or consolidation should not be ruled out.
Resistance level: 20308.00, 20704.00
Support level: 19935.00, 19395.00
Despite BTC maintaining a higher-high price pattern recently, it failed to break above the critical $90,000 resistance level and slid below $87,000, prompting traders to remain cautious about a potential bearish trend reversal. However, BTC ETFs continue to record net inflows, and the Crypto Fear and Greed Index shows improvement—both factors that could help provide support and limit downside risks for BTC prices.
BTC has been trading in a higher-high manner but failed to notch the $89,000 mark and encountered a retracement. Should BTC dip below the previous high at near the $86,000 mark, it may suggest a bearish signal for BTC. Both the RSI and MACD remain elevated, suggesting that BTC remains in trading with bullish momentum.
Resistance level: 92,825.00, 99,340.00
Support level: 84,875.00, 78,530.00
WTI crude rallied 1%-1.2% to $69.11/bbl, driven by the U.S. 25% tariff on Venezuelan oil buyers, while Brent hit $73/bbl. Market volatility remains high, balancing supply risks from tariffs against supply relief from Chevron’s extended Venezuela license (May 27). OPEC+ may proceed with a May output hike, while unconfirmed reports suggest potential U.S. restrictions on Iranian oil. Near-term, WTI could test $75-$80 if China and India reduce Venezuelan imports, but OPEC+ supply hikes and U.S. shale recovery pose downside risks.
Oil prices are now testing resistance at 69.24; a breakout above this level could signal further bullish momentum toward 70.49 and 71.78. However, both the RSI and MACD are showing bearish divergence, suggesting that upward momentum is weakening and a potential pullback or consolidation may occur. If prices fail to break higher, a correction toward 68.38 or 67.66 could be expected.
Resistance level: 69.24, 70.49
Support level: 68.38, 67.66
Trade forex, indices, metal, and more at industry-low spreads and lightning-fast execution.
Sign up for a PU Prime Live Account with our hassle-free process.
Effortlessly fund your account with a wide range of channels and accepted currencies.
Access hundreds of instruments under market-leading trading conditions.
Sign up for a PU Prime Live Account with our hassle-free process.
Effortlessly fund your account with a wide range of channels and accepted currencies.
Access hundreds of instruments under market-leading trading conditions.